Showing posts with label METERS. Show all posts

Linear RF Power Meter Circuit

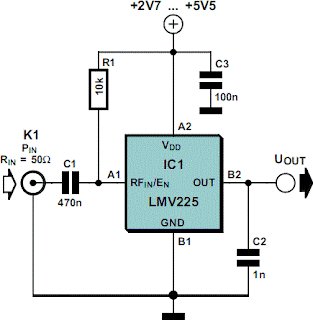
The National Semiconductor LMV225 is a linear RF power meter IC in an SMD package. It can be used over the frequency range of 450 MHz to 2000 MHz and requires only four external components. The input coupling capacitor isolates the DC voltage of the IC from the input signal. The 10-k? resistor enables or disables the IC according to the DC voltage present at the input pin. If it is higher than 1.8 V, the detector is enabled and draws a current of around 5–8 mA. If the voltage on pin A1 is less than 0.8 V, the IC enters the shutdown mode and draws a current of only a few microampères. The LMV225 can be switched between the active and shutdown states using a logic-level signal if the signal is connected to the signal via the 10-kR resistor.

Circuit diagram:
 Linear RF Power Meter Circuit Diagram
 Linear RF Power Meter Circuit Diagram

The supply voltage, which can lie between +2.7 V und +5.5 V, is filtered by a 100nF capacitor that diverts residual RF signals to ground. Finally, there is an output capacitor that forms a low-pass filter in combination with the internal circuitry of the LMV225. If this capacitor has a value of 1 nF, the corner frequency of this low-pass filter is approximately 8 kHz. The corner frequency can be calculated using the formula fc = 1 ÷ (2 p COUT Ro) where Ro is the internal output impedance (19.8 k?). The output low-pass filter determines which AM modulation components are passed by the detector.


The output, which has a relatively high impedance, provides an output voltage that is proportional to the signal power, with a slope of 40 mV/dB. The output is 2.0 V at 9 dBm and 0.4 V at –40 dBm. A level of 0 dBm corresponds to a power of 1 mW in 50 R. For a sinusoidal wave-form, this is equivalent to an effective voltage of 224 mV. For modulated signals, the relationship between power and voltage is generally different. The table shows several examples of power levels and voltages for sinusoidal signals. The input impedance of the LMV225 detector is around 50 R to provide a good match to the characteristic impedance commonly used in RF circuits.

The data sheet for the LMV225 shows how the 40-dB measurement range can be shifted to a higher power level using a series input resistor. The LMV225 was originally designed for use in mobile telephones, so it comes in a tiny SMD package with dimensions of only around 1 × 1 mm with four solder bumps (similar to a ball-grid array package). The connections are labelled A1, A2, B1 and B1, like the elements of a matrix. The corner next to A1 is bevelled.


http://streampowers.blogspot.com/2012/06/linear-rf-power-meter-circuit.html 
Read More

ESR & Low Resistance Test Meter

As electrolytic capacitors age, their internal resistance, also known as "equivalent series resistance" (ESR), gradually increases. This can eventually lead to equipment failure. Using this design, you can measure the ESR of suspect capacitors as well as other small resistances. Basically, the circuit generates a low-voltage 100kHz test signal, which is applied to the capacitor via a pair of probes. An op amp then amplifies the voltage dropped across the capacitor’s series resistance and this can be displayed on a standard multimeter. In more detail, inverter IC1d is configured as a 200kHz oscillator.
Its output drives a 4027 J-K flipflop, which divides the oscillator signal in half to ensure an equal mark/space ratio. Two elements of a 4066 quad bilateral switch (IC3c & IC3d) are alternately switched on by the complementary outputs of the J-K flipflop. One switch input (pin 11) is connected to +5V, whereas the other (pin 8) is connected to -5V. The outputs (pins 9 & 10) of these two switches are connected together, with the result being a ±5V 100kHz square wave. Series resistance is included to current-limit the signal before it is applied to the capacitor under test via a pair of test probes. Diodes D1 and D2 limit the signal swing and protect the 4066 outputs in case the capacitor is charged.
Circuit diagram:
esr-low-resistance-test-meter-circuit-diagram1 ESR & Low Resistance Test Meter Circuit Diagram
A second pair of leads sense the signal developed across the probe tips. Once again, the signal is limited by diodes (D3 & D4) before begin applied to the remaining two inputs of the 4066 switch (pins 2 & 3 of IC3a & IC3b). These switches direct alternate half cycles to two 1μF capacitors, removing most of the AC component of the signal and providing a simple "sample and hold" mechanism. The 1μF capacitors charge to a DC level that is proportional to the test capacitor’s ESR. This is differentially amplified by op amp IC4 so that it can be displayed on a digital multimeter – 10Ω will be represented by 100mV, 1Ω by 10mV, etc. To calibrate the circuit, first adjust VR1 to obtain 100kHz at TP3.
Next, momentarily short the test probes together and adjust VR4 for 0mV at pin 6 of IC4. That done, set your meter to read milliamps and connect it between TP4 and the negative (-) DMM output. Apply -5V to TP2 and note the current flow, which should be around 2.1mA. Transfer the -5V from TP2 to TP1 and adjust VR2 until the same current (ignore sign) is obtained. Remove the -5V from TP1. Again, set to your meter to read volts and connect it to the DMM outputs. Apply the probes to a 10W resistor and adjust VR3 for a reading of 100mV. Finally, ensure that all capacitors to be tested are always fully discharged before connecting the probes.
Read More

Save Your Ears - A Noise Meter

‘Hello… HELLO! Are you deaf? Do you have disco ears?’ If people ask you this and you’re still well below 80 , you may be suffering from hearing loss, which can come from (prolonged) listening to very loud music. You won’t notice how bad it is until it’s too late, and after that you won’t be able to hear your favorite music the way it really is – so an expensive sound system is no longer a sound investment. To avoid all this, use the i-trixx sound meter to save your ears (and your neighbor's ears!).
With just a handful of components, you can build a simple but effective sound level meter for your sound system. This sort of circuit is also called a VU meter. The abbreviation ‘VU’ stands for ‘volume unit’, which is used to express the average value of a music signal over a short time. The VU meter described here is what is called a ‘passive’ type. This means it does not need a separate power supply, since the power is provided by the input signal. This makes it easy to use: just connect it to the loudspeaker terminals (the polarity doesn’t matter) and you’re all set.
The more LEDs that light up while the music is playing, the more you should be asking yourself how well you are treating your ears (and your neighbours’ ears). Of course, this isn’t an accurately calibrated meter. The circuit design is too simple (and too inexpensive) for that. However, you can have a non-disco type (or your neighbors) tell you when the music is really too loud, and the maximum number of LED lit up at that time can serve you as a good reference for the maximum tolerable sound level.
Although this is a passive VU meter, it contains active components in the form of two transistors and six FETs. Seven LEDs light up in steps to show how much power is being pumped into the loudspeaker. The steps correspond to the power levels shown in the schematic for a sine-wave signal into an 8-ohm load. LED D1 lights up fi rst at low loudspeaker voltages. As the music power increases, the following LEDs (D2, D3, and so on) light up as well. The LEDs thus dance to the rhythm of the music (especially the bass notes).
Circuit diagram:
noise meter circuit diagram Noise Meter Circuit Diagram
This circuit can easily be assembled on a small piece of prototyping board. Use low-current types for the LEDs. They have a low forward voltage and are fairly bright at current levels as low as 1 mA. Connect the VU meter to the loudspeaker you want to monitor. If LED D2 never lights up (it remains dark even when LED D3 lights up), reverse the polarity of diode D8 (we have more to say about this later on). In addition, bear in mind that the sound from the speaker will have to be fairly loud before the LEDs will start lighting up.
If you want to know more about the technical details this VU meter, keep on reading. Each LED is driven by its own current source so it will not be overloaded with too much current when the input voltage increases. The current sources also ensure that the final amplifier is not loaded any more than necessary. The current sources for LEDs D1–D6 are formed by FET circuits. A FET can be made to supply a fixed current by simply connecting a resistor to the source lead (resistors R1–R6 in this case). With a resistance of 1 kΩ, the current is theoretically limited to 1 mA. However, in practice FETs have a especially broad tolerance range. The actual current level with our prototype ranged from 0.65 mA to 0.98 mA.
To ensure that each LED only lights up starting at a defined voltage, a Zener diode (D8–D13) is connected in series with each LED starting with D2. The Zener voltage must be approximately 3 V less than the voltage necessary for the indicated power level. The 3-V offset is a consequence of the voltage losses resulting from the LED, the FET, the rectifier, and the over voltage protection. The over voltage protection is combined with the current source for LED D7. One problem with using FETs as current sources is that the maximum rated drain–source voltage of the types used here is only 30 V.
If you want to use the circuit with an especially powerful fi nal amplifier, a maximum input level of slightly more than 30 V is much too low. We thus decided to double the limit. This job is handled by T7 and T8. If the amplitude of the applied signal is less than 30 V, T8 buffers the rectified voltage on C1. This means that when only the first LED is lit, the additional voltage drop of the over voltage protection circuit is primarily determined by the base–emitter voltage of T8. The maximum worst-case voltage drop across R8 is 0.7 V when all the LEDs are on, but it has increasingly less effect as the input voltage rises.
R8 is necessary so the base voltage can be regulated. R7 is fitted in series with LED D7 and Zener diode D13, and the voltage drop across R7 is used to cause transistor T7 to conduct. This voltage may be around 0.3 V at very low current levels, but with a current of a few mili-amperes it can be assumed to be 0.6 V. Transistor T7 starts conducting if the input voltage rises above the threshold voltage of D7 and D13, and this reduces the voltage on the base of T8. This negative feedback stabilizes the supply voltage for the LEDs at a level of around 30 V. With a value of 390 Ω for R7, the current through LED D7 will be slightly more than 1 mA.
This has been done intentionally so D7 will be a bit brighter than the other LEDs when the signal level is above 30 V. When the voltage is higher than 30 V, the circuit draws additional current due to the voltage drop across R8. The AC voltage on the loudspeaker terminals is half-wave rectifi ed by diode D14. This standard diode can handle 1 A at 400 V. The peak current level can be considerably higher, but don’t forget that the current still has to be provided by the fi nal amplifier.
Resistor R9 is included in series with the input to keep the additional load on the fi nal amplifi er within safe bounds and limit the interference or distortion that may result from this load. The peak current can never exceed 1.5 A (the charging current of C1), even when the circuit is connected directly to an AC voltage with an amplitude of 60 V. C1 also determines how long the LEDs stay lit. This brings us to an important aspect of the circuit, which you may wish to experiment with in combination with the current through the LEDs.
An important consideration in the circuit design is to keep the load on the fi nal amplifi er to a minimum. However, the combination of R9 and C1 causes an averaging of the complex music signal. The peak signal levels in the music are higher (or even much higher) than the average value. Tests made under actual conditions show that the applied peak power can easily be a factor of 2 to 4 greater than what is indicated by this VU meter. This amounts to 240 W or more with an 8-Ω loudspeaker.
You can reduce the value of C1 to make the circuit respond more quickly (and thus more accurately) to peak signal levels. Now a few comments on D8. You may receive a stabistor (for example, from the Philips BZV86 series or the like) for D8. Unlike a Zener diode, a stabistor must be connected in the forward-biased direction. A stabistor actually consists of a set of PN junctions in series (or ordinary forward-biased diodes). Check this carefully: if D2 does not light up when D8 is fi tted as a normal Zener diode, then D8 quite likely a stabistor, so you should fi t it the other way round.
Read More

LED Volt Meter Circuit Diagram

Here is a Simple LED Volt meter to Monitor the charge level in Lead Acid Battery or Tubular battery. The terminal voltage of the battery is indicated through a four level LED indicators. The nominal terminal voltage of a Lead Acid battery is 13.8 volts and that of a Tubular battery is 14.8 volts when fully charged. The LED voltmeter uses four Zener diodes to light the LEDs at the precise breakdown voltage of the Zener diodes. Usually the Zener diode requires 1.6 volts in excess than its prescribed value to reach the breakdown threshold level. When the battery holds 13.6 volts or more, all the Zener breakdown and all LEDs light up. When the battery is discharged below 10.6 volts, all the LEDs remain dark. So depending on the terminal voltage of the battery, LEDs light up one by one or turns off. 


Circuit diagram:
LED-Volt-Meter-circuit-diagram12 LED Volt Meter Circuit Diagram
Read More

Sensitive Audio Power Meter Circuit Diagram

As a follow-up to the simple audio power  meter described in [1], the author has developed a more sensitive version. In practice,  you  rarely  use  more  than  1 watt  of  audio  power in a normal living-room environment.  The only time most people use more is at a  party when they want to show how loud their  stereo system is, in which case peaks of more  than 10 W are not uncommon. With this circuit, the dual LED starts to light up  green at around 0.1 watt into 8 ohms (0.2 watt  into 4 ohms). Naturally, this depends on the  specific type of LED that is used.
 
Circuit diagram:
Sensitive Audio Power Meter-Circuit-Diagram
Sensitive Audio Power Meter Circuit Diagram
 
Here it is  essential to use a low current type. The capacitor is first charged via D1 and then discharged via the green LED. This voltage-doubler effect  increases the sensitivity of the circuit. Above a level of 1 watt, the transistor limits the current through the green LED and the red LED con ducts enough to produce an orange hue.The red colour predominates above 5 watts. Of course, you can also use two separate ‘normal’ LEDs. However, this arrangement cannot generate an orange hue. For any testing that may be necessary, you should use  generator with a DC-coupled output. If there is a capacitor in the output path, it can cause misleading results.
Reference: Simple Audio Power Meter, Elektor July & August 2008. 
http://streampowers.blogspot.com/2012/06/sensitive-audio-power-meter.html 
Read More

Stereo VU Meter Circuit Diagram

I like to see lights move to music. This project will indicate the volume level of the audio going to your speakers by lighting up LEDS. The LEDS can be any color so mix them up and really make it look good. The input of the circuit is connected to the speaker output of your audio amplifier. You want to build two identical units to indicate both right and left channels. The input signal level is adjusted by the 10k ohm VR. If you wish to make a very large scale model of this unit and hang it on your wall there is an optional output transistor that can drive many LEDS at once. The unit I built drove three LEDS for each output. The sequence of the LEDS lighting are as follows Pin 1, 18, 17, 16, 15, 14, 13, 12, 11, 10.

Stereo VU Meter Circuit Diagram

Stereo VU Meter Circuit Diagram
Read More

Digital Bike Tachometer Circuit Diagram

This is the simple tachometer for bikes uses 2 reed switches to urge the speed data of the bicycle. The reed switches are put in close to the rim of the wheel where permanent magnets pass by. The permanent magnets are connected to the wheelspokes and activate the reed switches everytime they pass by it. The speed is digitally displayed.

The tachometer circuit works in step with this principle; the pulses created by the reed contacts are counted inside an explicit time interval. The ensuing count is then displayed and represents the speed of the bike. 2 4026 ICs are used to count the pulses, decode the counter and management 2 7-segment LED show. RS flip-flops U3 and U4 perform as anti-bounce.

Electronic bicycle SP tachometer circuit diagram


The pulses arrive at the counter’s input through gate U7. The measuring amount is set by monostable multivibrator U5/U6 and might be adjusted through potentiometer P1 so the tacho are often calibrated. The circuit U1/U2 resets the counters.

Since batteries are used to power the circuit, it's not sensible to support the continual show of speed data. This circuit isn't continuously active. The circuit is activated solely once a button is pressed. a minimum of 3 permanent magnets should be put in on the wheel. The circuit are often calibrated with the assistance of another pre-calibrated tachometer.
Read More

Simple Voltmeter Circuit Diagram

This circuit provides a simple means to determine the voltage of a low-impedance voltage source. It works as follows. P1, which is a 1-W potentiometer, forms a voltage divider in combination with R1. The voltage at their junction is buffered by T1, and then passed to reference diode D1 via R3. D1 limits the voltage following the resistor to 2.5 V. An indicator stage consisting of T2, R4 and LED D2 is connected in parallel with D1. As long as the voltage is not limited by D1, the LED will not be fully illuminated. This is the basic operating principle of this measurement circuit.

 Simple Voltmeter Circuit Diagram

Simple Voltmeter Circuit Diagram1
Read More

Photo Meter Assesses Ambient Light Schematic

Most PN-junction diodes can be used as photodiodes. While not optimized for this application, they do work. When the diode is reverse biased, it will produce a small photovoltaic output as the light level is increased. LEDs are particularly suited for this task because their housings are transparent.

You can construct a simple circuit that will assess the condition of ambient lighting and, because many LEDs’ packages are tinted to enhance their emitted color, may even yield a reasonable evaluation of the detected color. The results are not as effective as those obtained using a high-quality optical filter, which typically has narrow bandpass characteristics, but they can be quite acceptable. Though the design described here does not produce the accuracy of designs with laboratory-grade photodetectors and transimpedance amplifiers, it can be quickly assembled and will produce usable results at a low cost.

Three LEDs are used; experimentation will indicate which device has the best sensitivity to which color (Figure 1). The ambient light falling on the LEDs causes some current flow—typically in the range of 10 to 100 nA—through each LED, depending on the applied illumination level. This current flows through the base of a transistor, Q1, and is amplified. Q1’s collector current then splits between potentiometer R4, which acts as a first-stage gain calibration, and the base of Q2.

Photo Meter Assesses Ambient Light Schematic
Simple Photo Meter Assesses Ambient Light Schematic

Q2 provides further amplification and drives the left side of a bridge circuit (D1A and D1B). Note that R2/D1 and R3/D2 form a balanced bridge. Q2’s collector current provides a slight imbalance to the bridge. The meter, M, measures this imbalance. R5 adjusts the sensitivity of the meter. Set R4 and R5 such that the meter has an appropriate deflection. R4 is useful for selecting the quiescent point; R5 is useful for adjusting the sensitivity.

Before building the circuit, check whether the LEDs can be used as photo sensors. To determine whether a given LED is a good photodiode, check the voltage across the LED using a common digital multimeter set to its most sensitive range—typically 200 mV. Typical output voltage should be approximately 0.3 to 1 mV with typical office illumination.
Read More

Simple Wireless Auto Tachometer Circuit Diagram

Anyone performing their own automobile tune-ups knows how important it is to know your engines speed. With this tachometer, you can measure your engines speed without any connections or annoying timing lights. 
  
Wireless Auto Tachometer Circuit Diagram

New Wireless Auto Tachometer
PC board layout and parts placement 

New Wireless Auto Tachometer


  1. Calibrate the unit as folows:
    1. Set up this circuit:
      This is the setup for calibrating the Tach
    2. Turn on the Tach and allow a few minutes for temperature stabilization.
    3. Set S2 to 4 cylinders and adjust R5 for a meter indication of 180 (1800 rpm).
    4. Set S2 to 6 cylinders and adjust R6 for a meter indication of 120 (1200 rpm).
    5. Set S2 to 8 cylinders and adjust R7 for a meter indication of 90 (900 rpm).
  2. To use the Tach, turn it on and let it sit for one minute to allow for temperature stabilization. Extend the antenna, select the right number of cylinders and hold the unit over the engine. If the reading is erratic or the needle jumps around, move the antenna closer to the ignition coil or spark plug wires.
  3. The unit draws power from the car battery. If it is connected backwards, it will not work, but it won't be damaged.
Read More

10 LED Bar Dot VU Meter Circuit based LM3915

Build a 10 LED Bar Dot VU meter circuit based LM3915. It differs in many respects from other applications on the same chip. The circuit is intended for those who want a VU meter that is connected directly to the output of an power amplifier.

 10 LED Bar Dot VU Meter Circuit based LM3915 Circuit Diagram


Build a 10 LED Bar Dot VU Meter Circuit based LM3915

It’s possible to adjust the sensitivity to work with amplifiers that have different output power, you just need to change the value of R1 according to Table 1. In case you did’n find the exact resistor value, then choose the next standard value (for example if you cannot find 33K ohm, then find the 36K ohm), or if you want maximum accuracy you need to put resistors in series or in parallel to achieve the correct value.

Build a 10 LED Bar Dot VU Meter Circuit based LM3915
 
You can use various types of LEDs (round or square) to get the visual and aesthetic result you want. The switch S1 will allow you to choose whether VU meter will work as a bar or one by one (dot). In position ON [closed switch], the LED operation is Bar, while in position OFF [open switch], the LED operate in Dot. In Bar mode, the power consumption rises because all of the LED will be work and can reach up to 150mA.

For amplifier with two channels is obvious that we should build two identical circuits, one for each channel. The operating voltage of the circuit is +12 V. Taking this trend should be done by the tendency of the amp. Usually amps work with voltages which higher than +12 Volts for the circuit. For this reason, we must added a component which can decrease, regulate and stabilize the +Vp voltage at +12 Volts. The component we are used is IC2 (LM317) which is an adjustable voltage regulator and stabilizer.

Using a small brushing is necessary because the differences in the potential entry; output is large so that we develop high levels of temperature. The use of R5 helps in voltage drop to descend the voltage at the input of IC2 at lower levels. The calculation of this resistance is more empirically using Ohm’s law. The voltage at the input of IC2 must be higher than +16 Volts. For example, if the voltage of the amplifier is +50 Volts, we should have a voltage drop 50-16 = 34 Volts on the resistance R5. For the electric current, 50mA average is needed by the circuit [may be up to 150mA], the value of R5 = V / I = 34/0.05 = 680 ohms 2W. You may need to increase or decrease this value by trials. Because the resistor is going to heat up, then it will be better to put some distance from the PCB.

It will be better to set up and measure the output vltage of the IC2 by adjusting TR1 first, you need yo remove IC1 to secure the IC1. If you are able to supply the stabilized +12 V from somewhere in the amplifier circuit, then you’ll need to remove the R5, the IC2 and materials inside the dotted line.

PCB layout design:

PCB

Read More

Remote Field Strength Meter Circuit Diagram

Remote Field Strength Meter Circuit Diagram. This field strength meter consists of a tuned crystal detector producing a dc output voltage from a transmitted signal. The dc voltage is used to shift the frequency of a transmitter of 100-mW power operating at 1650 kHz. The frequency shift is proportional to the received field strength. This unit has a range of several hundred feet and is operated under FCC part 15 rules (100-mW max power into a 2-m-iong antenna between 510 and 1705 kHz).

Remote Field Strength Meter Circuit Diagram

Remote Field Strength Meter Circuit Diagram

Read More